Google Forms is a powerful tool that allows users to create surveys, quizzes, and questionnaires. It provides a simple and efficient way to collect data and gather insights. One of the key features of Google Forms is the ability to publish analytics, which provides valuable information about the responses received. In this article, we will explore what publish analytics means in Google Forms and how it can be used to gain insights and make data-driven decisions.
Contents
Understanding Google Forms
Before diving into the concept of publish analytics, let’s first understand what Google Forms is and how it works. Google Forms is a web-based application that allows users to create and share surveys or forms. It offers a wide range of question types, including multiple-choice, short answer, and rating scales, making it suitable for various purposes such as feedback collection, event registration, and market research.
Once a form is created, it can be shared with respondents via a link or embedded in a website. Respondents can then fill out the form online, and their responses are automatically collected and stored in a Google Sheets spreadsheet. This makes it easy to organize and analyze the data.
The Importance of Analytics
Analytics play a crucial role in any data-driven decision-making process. They provide insights into the collected data, helping users understand patterns, trends, and correlations. By analyzing the data, organizations can make informed decisions, identify areas for improvement, and measure the effectiveness of their strategies.
Read:Which of the following is a benefit of internal data?Google Forms offers a range of analytics features that allow users to gain valuable insights from the collected responses. These features include summary statistics, charts, and the ability to publish analytics.
What is Publish Analytics?
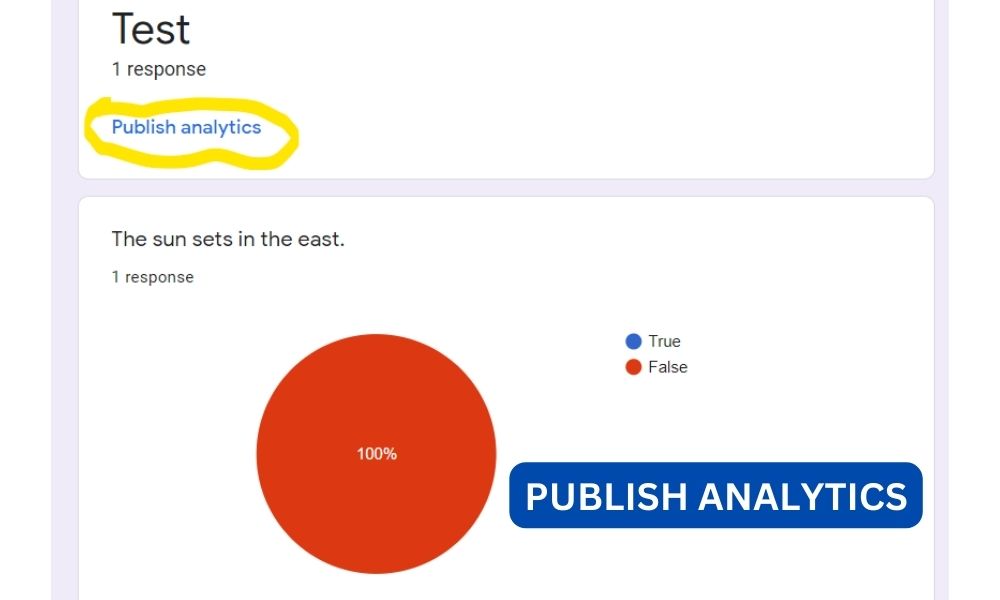
Publish analytics in Google Forms refers to the process of sharing the collected data and insights with others. When you publish analytics, you make the data and visualizations available to a wider audience, such as team members, stakeholders, or clients. This can be done by sharing a link to the analytics or embedding them in a website or presentation.
By publishing analytics, you enable others to view and interact with the data, empowering them to draw their own conclusions and make data-driven decisions. This is particularly useful in collaborative environments or when presenting findings to a larger audience.
How to Publish Analytics in Google Forms
Now that we understand what publish analytics means, let’s explore how to actually publish analytics in Google Forms. The process is straightforward and can be done in a few simple steps:
- Open the Google Forms response spreadsheet.
- Click on the “Form” menu at the top of the spreadsheet.
- Select “Publish analytics.”
- Choose the type of analytics you want to publish, such as summary statistics or charts.
- Customize the settings and appearance of the published analytics.
- Click “Publish” to generate a link or embed code.
- Share the link or embed code with the intended audience.
Once the analytics are published, anyone with access to the link or embedded content can view and interact with the data. They can explore the summary statistics, interact with the charts, and even filter the data to focus on specific subsets.
Read:How to link Paypal to Robinhood? Here is InformationBenefits of Publishing Analytics
Publishing analytics in Google Forms offers several benefits that can enhance collaboration, decision-making, and data communication. Some of the key benefits include:
- Improved Collaboration: By publishing analytics, team members can easily access and analyze the data, fostering collaboration and enabling collective decision-making.
- Enhanced Data Communication: Visualizations such as charts and graphs make it easier to communicate complex data findings to a wider audience, facilitating understanding and engagement.
- Increased Transparency: Publishing analytics promotes transparency by making the data and insights accessible to all stakeholders, ensuring everyone has access to the same information.
- Empowered Decision-Making: When analytics are published, individuals can explore the data themselves, empowering them to make data-driven decisions based on their unique perspectives and needs.
Real-World Examples
Let’s explore a couple of real-world examples to illustrate how publishing analytics in Google Forms can be beneficial:
Example 1: Employee Satisfaction Survey
An organization conducts an employee satisfaction survey using Google Forms. After collecting the responses, the HR team publishes the analytics to share the findings with the management team. By publishing the analytics, the management team can explore the data, identify areas of concern, and make informed decisions to improve employee satisfaction.
Read:How to link Paypal to Robinhood? Here is InformationExample 2: Market Research Survey
A marketing agency conducts a market research survey to gather insights about consumer preferences. After analyzing the responses, the agency publishes the analytics to share the findings with their clients. By publishing the analytics, the agency enables their clients to explore the data, understand consumer trends, and make data-driven marketing decisions.
Conclusion
Publishing analytics in Google Forms is a powerful feature that allows users to share the collected data and insights with a wider audience. By publishing analytics, organizations can enhance collaboration, improve data communication, increase transparency, and empower decision-making. Whether it’s analyzing employee satisfaction or conducting market research, publishing analytics in Google Forms enables users to make data-driven decisions and drive positive outcomes.


